Consequence of Failure
Consequence of Failure puts a dollar figure on the consequences of every pipe break: repair and restoration, plus service interruption, traffic, water loss and impact on critical facilities.
Same pipe · side street
$9,000
6-inch main under a residential street. Repair and restore.
Same pipe · near a hospital
$75,000+
Damages, emergency response and public safety risk.
Two pipes can share a Likelihood of Failure and still carry very different consequences.
Who it’s for
Utility executives, asset managers and consulting engineers planning investment by real-world impact, not just by likelihood of failure.
LOF shows where breaks are most likely. COF shows which ones would hurt the most.
| Direct cost | Indirect and consequential cost |
|---|---|
| Excavation, repair and pipe replacement | Service interruption to downstream customers |
| Pavement and surface restoration | Traffic disruption and detour duration |
| Emergency crew mobilization and overtime | Impact on hospitals, schools, emergency services |
| Intense repair (HDD, jack and bore) near rail and major routes | Water lost, environmental exposure, property and third-party damage |
Why utilities use it
Replace or reinforce the pipes whose failure would cause the greatest harm, not just the ones most likely to break.
Land use, population density, traffic, customer type and nearby critical facilities feed a total cost for every segment.
A transparent, data-backed basis for investment that stands up to boards, regulators and auditors.
How it works
01
Pipe material, diameter, installation year and location.
02
Land use, traffic volume, population density and proximity to critical facilities.
03
Trained on thousands of historical break events to learn which conditions lead to the biggest impacts.
04
A dollar estimate for every pipe, mapped in your GIS and recalibrated as new failures are recorded.
Scenario Builder
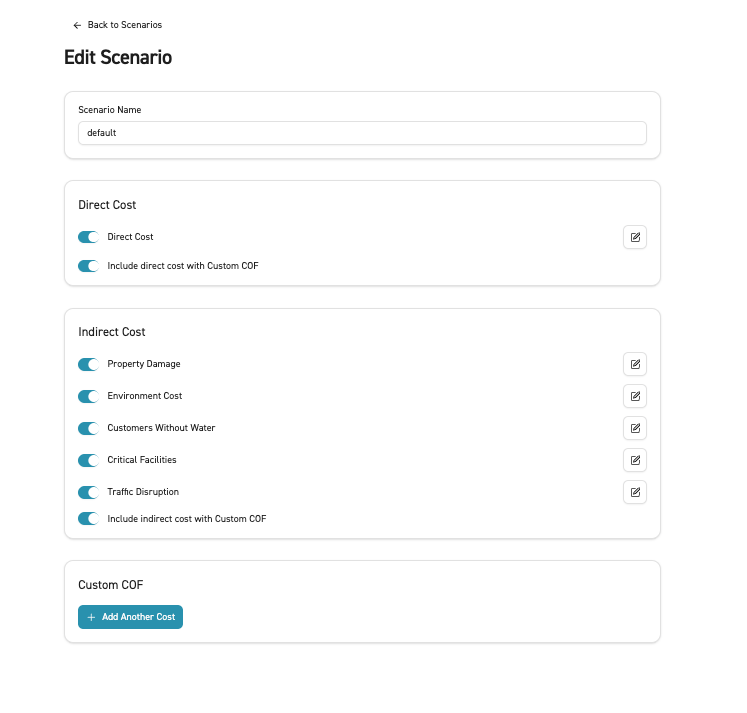
Switch each direct and indirect cost factor on or off and calibrate it to local figures. Save named scenarios, such as conservative and aggressive, and COF and Total Risk update with the one you select.
COF map
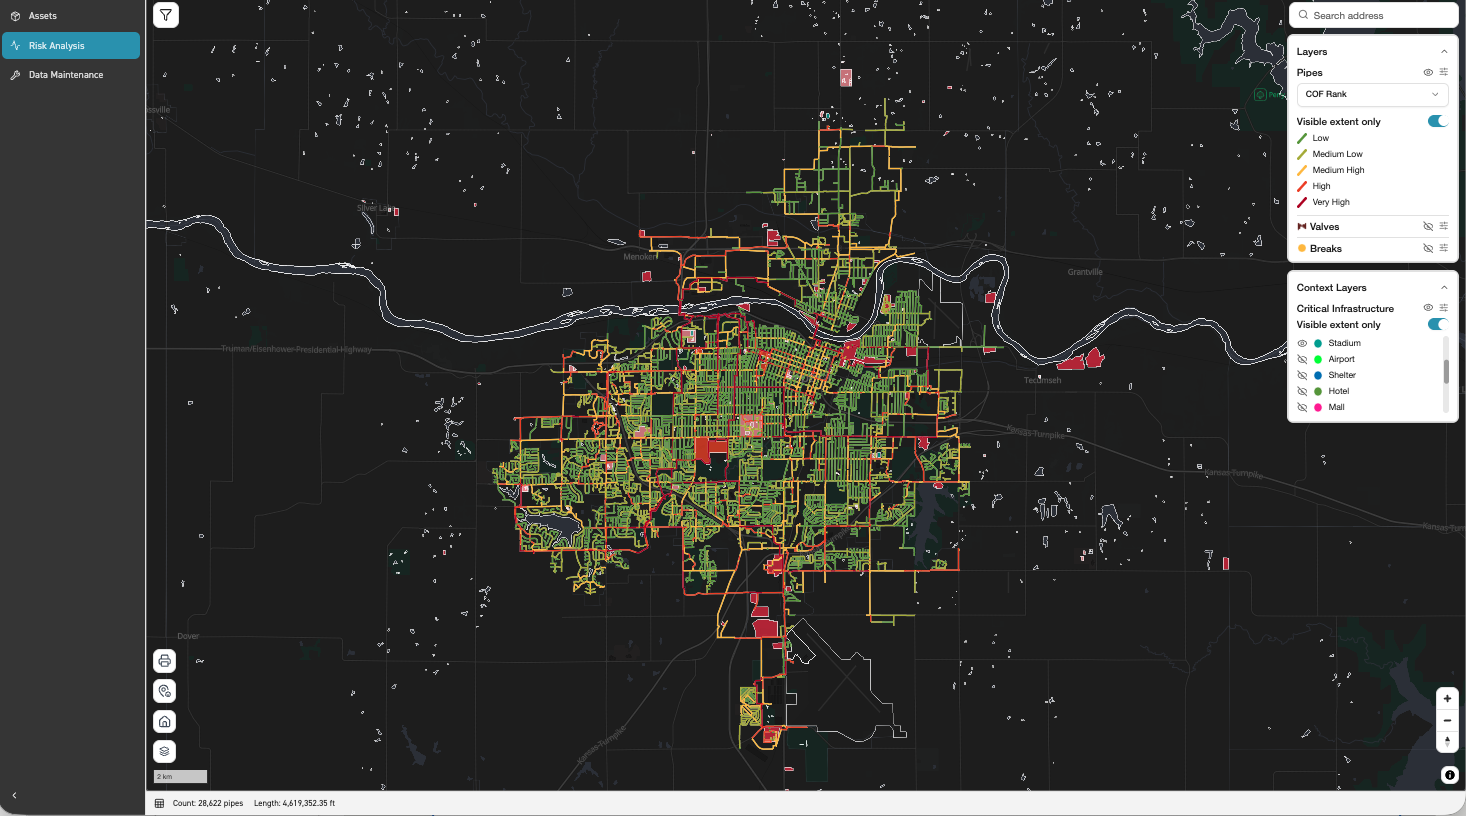
Every segment is colour-coded by its Consequence of Failure. Red marks the mains whose failure would cause the most disruption, cost or impact on critical facilities and major corridors.
Customers affected
From simplest to most precise. Pick the one your data supports.
Method 1
Census population density within a 50 m buffer of the pipe.
Method 2
Uses your valve layer to find which adjacent pipes are isolated when a pipe fails.
Method 3
Upload customers out of service and below 20 psi per pipe from your own hydraulic model as a CSV.
Combine Consequence of Failure with Likelihood of Failure to get Total Risk: the dollars at risk on every segment.
Live webinar · Tue, Dec 8 · 9:00 AM PT / 12:00 PM ET
How West Slope Water District uses Fracta AI to act like a larger utility.
Save my seat